Almost half of Britain's population lives in areas where economic growth fails to improve living standards, according to research by consultancy firm PwC, which identifies a pronounced divide between prosperous southern regions and struggling northern areas.
The analysis reveals that 12.5 million households—46% of the total—inhabit parts of the country where increased business investment and job creation have not translated into better quality of life. This disconnect between national economic expansion and household prosperity raises fundamental questions about how growth is distributed across the UK.
Prime Minister Andy Burnham has made tackling regional inequality and cost-of-living pressures central to his leadership agenda. However, his economic strategy faces scrutiny as rising government borrowing costs threaten to constrain public spending decisions. According to external reporting, Burnham has committed to maintaining fiscal discipline and sticking to existing rules that require day-to-day spending to be balanced with revenues by the end of the decade, while pledging not to raise the main rates of income tax, VAT or National Insurance.
The PwC report, released on Thursday, measures household spending power by examining income after taxes and housing costs, adjusted for household size and composition to reflect money genuinely available for other essential expenses. This metric provides a clearer picture of whether economic growth actually improves living standards than GDP figures alone.
Which regions are worst affected?
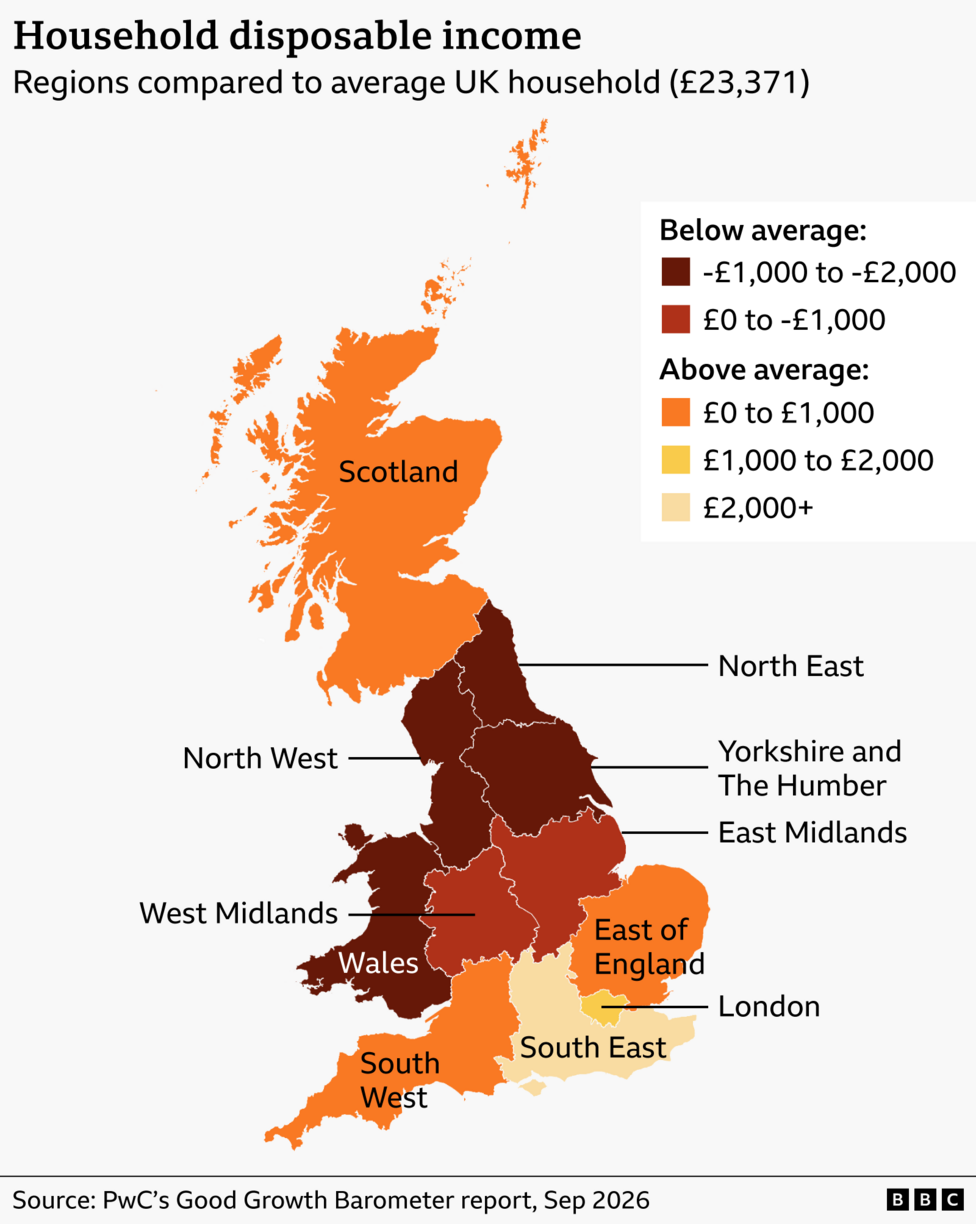
Every region north of the Midlands, plus Wales, recorded spending power below the national average of £23,371 annually. The North East experienced the sharpest deficit, with households having £1,542 less annual spending power than the UK average—a 6.6% shortfall. The North West lagged by £1,493, while Yorkshire and the Humber fared worst among northern regions at £1,917 below average.
By contrast, the South East enjoyed spending power 9% above the national average, worth an additional £2,154 per household annually. London followed closely, with disposable income £1,883 above average. Scotland and the South West bucked the regional trend, achieving spending power slightly above the national average thanks to lower housing costs and smaller household sizes.
Even within affluent areas, stark disparities emerged. In London, Richmond's average annual disposable income reached £35,448—nearly double the £18,384 recorded in neighbouring Hammersmith and Fulham, demonstrating that prosperity divides exist on a micro-geographic scale.
Why doesn't economic growth automatically improve living standards?
Economic growth typically generates additional spending, creates jobs, increases tax revenues and enables wage rises. In theory, these benefits should leave people materially better off. However, PwC research indicates that only a fraction of GDP growth translates into increased household spending power, and the benefits take time to materialise and do not reach everyone equally.

Housing costs significantly influence this disparity. Although southern England's higher property values and rents reduce household spending power compared to what raw income figures suggest, the impact is offset by substantially higher incomes in those regions. Northern areas lack this compensating income advantage, leaving households genuinely worse off despite any national growth.
The UK economy expanded by 1.2% in the first six months of 2026 according to official figures, yet living standards fell by 0.8% in the first quarter of 2026 despite this growth being the fastest in the G7, with rising taxes and costs pressuring households.
What do researchers say about the findings?
The research shows just how differently prosperity is experienced across the UK, with stark variations not only between regions but on each other's doorstep,said Rachel Taylor, government and health industries leader at PwC.
The report argues that devolution—the transfer of power from central government to local authorities—must enable local areas to retain more revenues generated by local economic growth and exercise greater freedom over resource allocation. However, the researchers emphasise that success should be judged not merely by whether local economies expand, but by whether that expansion produces genuine prosperity, wider opportunity and improved living standards for residents and communities.
How is the government responding?
Burnham's administration has positioned devolution as central to its growth strategy, with pledges to establish conditions for prosperity in every postcode. The creation of No10 North—a government office in the north of England—forms part of this approach. A government spokesperson stated that
we have already announced unprecedented financial powers to English mayors so they can receive a share of income tax revenues to boost local economies and improve public services.
Beyond fiscal measures, Burnham's agenda includes a stronger industrial strategy to support growth outside London and the South East, plus a possible package of financial support for families expected within weeks. His economic pitch explicitly rejects trickle-down economics in favour of direct regional investment and lower essential costs.
Conservative leader Kemi Badenoch has challenged this approach, arguing that
He thinks that if government spends more money, we will all get richer - that is not how this works.She has also dismissed the establishment of No10 North as a
gimmick.
What happens next?
The Office for National Statistics is scheduled to release consumer trends data for July to September 2026 in December 2026, which will provide updated insight into household spending patterns. Regional spending power projections indicate further increases ahead, with core spending power forecast to rise from £83.5 billion in 2026–27 to £90.5 billion by 2028–29, offering the next benchmark for assessing whether regional inequality narrows.
Key Facts:
- 46% of UK households (12.5 million) live in areas where economic growth does not improve living standards
- Northern regions and Wales have spending power 6.6% to 8.2% below the national average, while the South East exceeds it by 9%
- Within London, disposable income varies by nearly 100% between the richest and poorest boroughs
- PwC measures spending power as income after taxes and housing costs, adjusted for household size
- The government is using devolution and regional investment to attempt to narrow the North-South divide