

Healthcare as a Central Issue in the Scottish Election
Healthcare remains a pivotal topic throughout the Scottish election campaign. The NHS represents over one-third of the Scottish Parliament's budget and is widely regarded as a highly valued public service by voters.
Political parties frequently debate patient experiences and often compare Scotland's NHS with services in other parts of the UK, selectively citing statistics to support their positions.
BBC Verify has examined four key performance indicators to evaluate progress and the validity of comparing Scotland's health service with those in other UK nations.
Hospital Waiting Lists – Duration of Patient Waits
Waiting times for non-urgent hospital treatments can extend over months or even years. The Scottish Government has focused on reducing the longest waits exceeding 52 weeks, with ministers highlighting a consistent month-on-month decline in these cases.
Long waits have decreased for nine consecutive months; however, the target to eliminate waits over a year by the end of March was not achieved. Over 44,000 patients remain on waiting lists exceeding 52 weeks.
Comparisons of hospital waiting times across the UK are challenging. Guidance from the Office for National Statistics (ONS) and Public Health Scotland (PHS) explicitly advises against comparing Scotland's hospital waiting times and lists with those in England and Wales.
The UK Statistics Authority, while reprimanding Labour MP and UK government energy minister Michael Shanks for an incorrect comparison of systems in three ways, acknowledged that this can be "frustrating."
Data collection methods differ: England's data counts patients waiting to start treatment, whereas PHS data includes patients at various stages between diagnosis and treatment. In Scotland, a single patient may appear on multiple waiting lists.
PHS estimates that approximately 10% of Scotland's population was on at least one outpatient, inpatient, or day-case waiting list as of 28 February.
Long waits are not unique to Scotland. Although direct comparisons are not feasible, data from the other UK nations indicate that waits exceeding a year persist.
NHS England reported 136,000 patients waiting over a year at the end of January. Northern Ireland had more than 33,000 patients waiting longer than a year as of December 2025. Wales reported 115,700 pathways with waits over one year.
Diagnostic tests, including four types of endoscopy (such as colonoscopies) and four radiology tests (including CT and MRI scans), are another critical aspect of hospital care. PHS advises against comparing waiting times for these diagnostics across the UK due to inconsistent definitions.

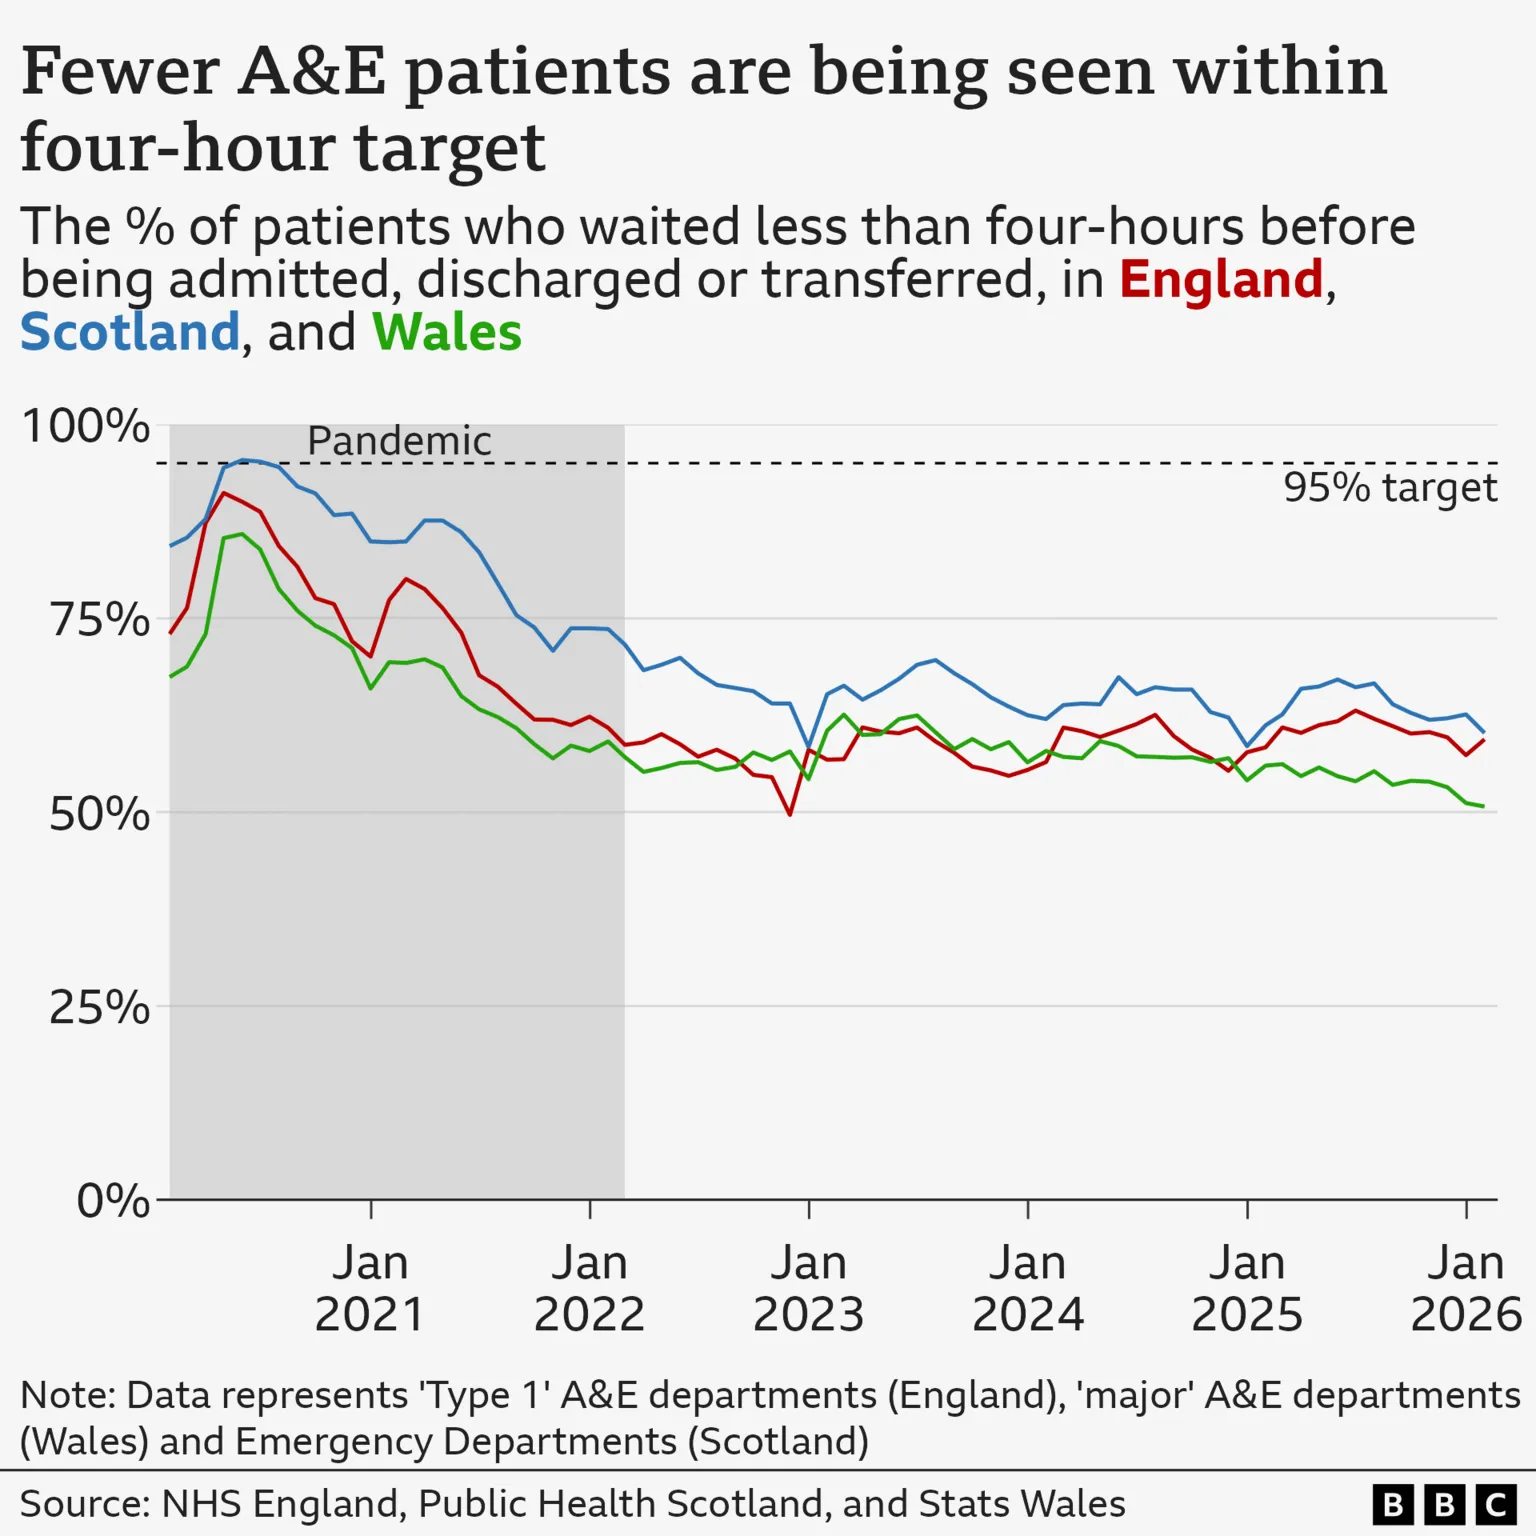
A&E Waiting Times – Meeting Targets Across Nations
Accident and Emergency (A&E) waiting times are a frequently debated area of healthcare and are largely comparable across the UK.
Scotland and Wales maintain a target that 95% of patients should be seen, admitted, transferred, or discharged within four hours of arrival at an emergency department. England had this target until June last year, when it was lowered to 78%. Northern Ireland's differing policy on when the A&E "clock" starts and stops precludes direct comparison.
Since the Covid-19 pandemic, all four nations have consistently missed their A&E waiting time targets.
Although Scotland has generally performed better than England and Wales over the years, it remains significantly below its 95% target.

Ambulance Response Times – Evaluating Speed of Care
Ambulance response times in Scotland and across the UK continue to be closely scrutinized amid reports of patients waiting hours for emergency care.
The Scottish Ambulance Service reports median weekly response times using a prioritised colour-coded system: purple (most life-threatening conditions such as heart attacks), red, amber, and yellow (less serious incidents).
Purple call-outs generally meet the seven-minute target, with response times ranging from six minutes 27 seconds to eight minutes nine seconds over recent years. Yellow call-outs, representing less urgent cases, typically experience longer waits.
However, ambulance response time data are not directly comparable across the UK due to differences in data collection methods, population demographics, and geographical factors.
It is possible, nonetheless, to assess how each nation performs relative to its own targets. NHS England data indicate that annual and monthly mean response times for category one call-outs routinely exceed their target.
Cancer Care – Meeting Treatment Targets
Scotland has established targets whereby 95% of diagnosed cancer patients should begin treatment within 31 days of a decision to treat, and 95% of patients urgently referred with suspected cancer should start treatment within 62 days of referral receipt.
The first target is routinely met by the Scottish health service, but the second has not been achieved for several years.
Despite similar 31- and 62-day measures in other UK nations, differences in recording practices mean direct comparisons of cancer waiting times between Scotland and the rest of the UK are not possible, according to PHS, NHS England, and the ONS.
However, general trends and adherence to national targets can be observed. England remains relatively close to its 31-day target but, like Scotland, falls short of the 62-day target. Northern Ireland also performs better against its 31-day target than the 62-day measure. Wales similarly fails to meet its 62-day target.
Other Healthcare Areas – Delayed Discharges and Workforce
Beyond the four key performance indicators, BBC Verify examined other healthcare themes for cross-UK comparison.
Delayed discharges, which occur when patients are medically ready to leave hospital but remain due to unavailable social care, support, or housing, cannot be compared across the UK.
PHS states that differences in data definitions and recording practices render Scottish data incomparable with other UK nations.
Workforce figures, including general practitioner (GP) numbers, also lack comparability.
NHS Education for Scotland, responsible for recording employment levels and vacancies, notes that differing workforce policies and statistical methods mean staffing numbers, including GP counts, are not directly comparable with those in other UK countries.
Additional reporting by Lucy Dady, Rob England, and Amy Jackson.


